Code
#import CA DOJ data on arrest dispositionsThis notebook looks at data from the State of California Department of Justice’s Open Justice site in an attempt to analyze the role played by race in determining the outcomes – “dispositions” – of arrests and the use of force during arrests. Below is the code used to experiment and investigate.
#import CA DOJ data on arrest dispositionsimport pandas as pd
df = pd.read_csv('./OnlineArrestDispoData1980-2020.csv')#select for arrests after the year 2010
#separate the data by the race of people arrested and the disposition codedf = df[df['YEAR'] > 2010]
df['TOTAL'] = df['F_TOTAL'] + df['M_TOTAL'] + df['S_TOTAL']import matplotlib.pyplot as plt
df_race = df[df['RACE'] == "Black"]
df_release = df_race[df_race['ARREST_DISP_CODE'] == "Released"]
df_complaint_sought = df_race[df_race['ARREST_DISP_CODE'] == "Complaint Sought"]
df_to_other = df_race[df_race['ARREST_DISP_CODE'] == "To Other Agency"]
df_within_dept = df_race[df_race['ARREST_DISP_CODE'] == "Within Department"]
df_probation = df_race[df_race['ARREST_DISP_CODE'] == "Juvenile Probation"]
total_arrest = df_race['TOTAL'].sum()
total_release = df_release['TOTAL'].sum()
total_complaint_sought = df_complaint_sought['TOTAL'].sum()
total_to_other = df_to_other['TOTAL'].sum()
total_within_dept = df_within_dept['TOTAL'].sum()
total_probation = df_probation['TOTAL'].sum()
# initialize list of lists
data = [['Black',(total_release/total_arrest)*100,
(total_to_other/total_arrest)*100, (total_within_dept/total_arrest)*100,
(total_probation/total_arrest)*100, (total_complaint_sought/total_arrest)*100]]
df_data_black = pd.DataFrame(data, columns = ['Race', 'Released', 'To Other Agency',
'Within Department', 'Juvenile Probation', 'Complaint Sought'])
df_race = df[df['RACE'] == "White"]

df_release = df_race[df_race['ARREST_DISP_CODE'] == "Released"]
df_complaint_sought = df_race[df_race['ARREST_DISP_CODE'] == "Complaint Sought"]
df_to_other = df_race[df_race['ARREST_DISP_CODE'] == "To Other Agency"]
df_within_dept = df_race[df_race['ARREST_DISP_CODE'] == "Within Department"]
df_probation = df_race[df_race['ARREST_DISP_CODE'] == "Juvenile Probation"]

total_arrest = df_race['TOTAL'].sum()

total_release = df_release['TOTAL'].sum()
total_complaint_sought = df_complaint_sought['TOTAL'].sum()
total_to_other = df_to_other['TOTAL'].sum()
total_within_dept = df_within_dept['TOTAL'].sum()
total_probation = df_probation['TOTAL'].sum()

# initialize list of lists
data = [['White',(total_release/total_arrest)*100,
         (total_to_other/total_arrest)*100, (total_within_dept/total_arrest)*100,
          (total_probation/total_arrest)*100, (total_complaint_sought/total_arrest)*100]]

df_data_white = pd.DataFrame(data, columns = ['Race', 'Released', 'To Other Agency',
                                         'Within Department', 'Juvenile Probation', 'Complaint Sought'])
df_race = df[df['RACE'] == "Hispanic"]

df_release = df_race[df_race['ARREST_DISP_CODE'] == "Released"]
df_complaint_sought = df_race[df_race['ARREST_DISP_CODE'] == "Complaint Sought"]
df_to_other = df_race[df_race['ARREST_DISP_CODE'] == "To Other Agency"]
df_within_dept = df_race[df_race['ARREST_DISP_CODE'] == "Within Department"]
df_probation = df_race[df_race['ARREST_DISP_CODE'] == "Juvenile Probation"]

total_arrest = df_race['TOTAL'].sum()

total_release = df_release['TOTAL'].sum()
total_complaint_sought = df_complaint_sought['TOTAL'].sum()
total_to_other = df_to_other['TOTAL'].sum()
total_within_dept = df_within_dept['TOTAL'].sum()
total_probation = df_probation['TOTAL'].sum()

# initialize list of lists
data = [['Hispanic',(total_release/total_arrest)*100,
         (total_to_other/total_arrest)*100, (total_within_dept/total_arrest)*100,
          (total_probation/total_arrest)*100, (total_complaint_sought/total_arrest)*100]]

df_data_hispanic = pd.DataFrame(data, columns = ['Race', 'Released', 'To Other Agency',
                                         'Within Department', 'Juvenile Probation', 'Complaint Sought'])
df_race = df[df['RACE'] == "Other"]

df_release = df_race[df_race['ARREST_DISP_CODE'] == "Released"]
df_complaint_sought = df_race[df_race['ARREST_DISP_CODE'] == "Complaint Sought"]
df_to_other = df_race[df_race['ARREST_DISP_CODE'] == "To Other Agency"]
df_within_dept = df_race[df_race['ARREST_DISP_CODE'] == "Within Department"]
df_probation = df_race[df_race['ARREST_DISP_CODE'] == "Juvenile Probation"]

total_arrest = df_race['TOTAL'].sum()

total_release = df_release['TOTAL'].sum()
total_complaint_sought = df_complaint_sought['TOTAL'].sum()
total_to_other = df_to_other['TOTAL'].sum()
total_within_dept = df_within_dept['TOTAL'].sum()
total_probation = df_probation['TOTAL'].sum()

# initialize list of lists
data = [['Other',(total_release/total_arrest)*100,
         (total_to_other/total_arrest)*100, (total_within_dept/total_arrest)*100,
          (total_probation/total_arrest)*100, (total_complaint_sought/total_arrest)*100]]

df_data_others = pd.DataFrame(data, columns = ['Race', 'Released', 'To Other Agency',
                                         'Within Department', 'Juvenile Probation', 'Complaint Sought'])
#display the disposition data, now sorted by race & dispositiondf_final = pd.concat([df_data_black, df_data_white, df_data_hispanic, df_data_others])
df_final = df_final.set_index('Race')
df_final.plot.barh(stacked=True)<AxesSubplot:ylabel='Race'>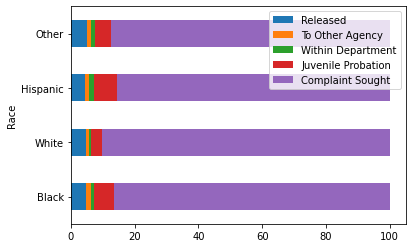
The majority of arrests by far result in a complaint sought, regardless of race. For the disposition of a referral to juvenile probation, Black and Hispanic individuals dominate numerically.
#import CA DOJ data on use of force during arrests force_df = pd.read_csv('./URSUS_Civilian-Officer_2020.csv')#break down the population of victims of force during arrests by raceofficer_force_df = force_df[force_df['Civilian_Officer'] == "Civilian"]
force_racial_breakdown_df = officer_force_df.groupby(['Race_Ethnic_Group'], as_index=True).size()
force_racial_breakdown_df.plot.barh()<AxesSubplot:ylabel='Race_Ethnic_Group'>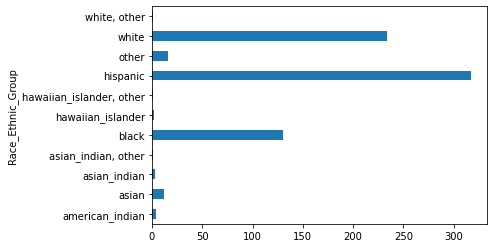
Hispanic individuals are clearly the victims of force during arrests at a far greater rate than individuals of any other race or ethnic group, with white people coming at second.
#break down the (assaultive) resistance of defendants during arrests by racecivilian_resistance_df = force_df[force_df['Civilian_Officer'] == "Civilian"]
civilian_resistance_df = civilian_resistance_df[civilian_resistance_df['CIVILIAN_Resistance_Type'] =="assaultive"]
racial_breakdown_df = civilian_resistance_df.groupby(['Race_Ethnic_Group'], as_index=True).size()
racial_breakdown_df.plot.barh(stacked= True)<AxesSubplot:ylabel='Race_Ethnic_Group'>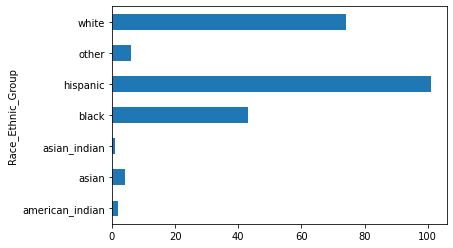
Here, too, Hispanics outnumber every other racial and ethnic group.